A nice java library called opencsv allows you to import the csv file content and make charts out of it.
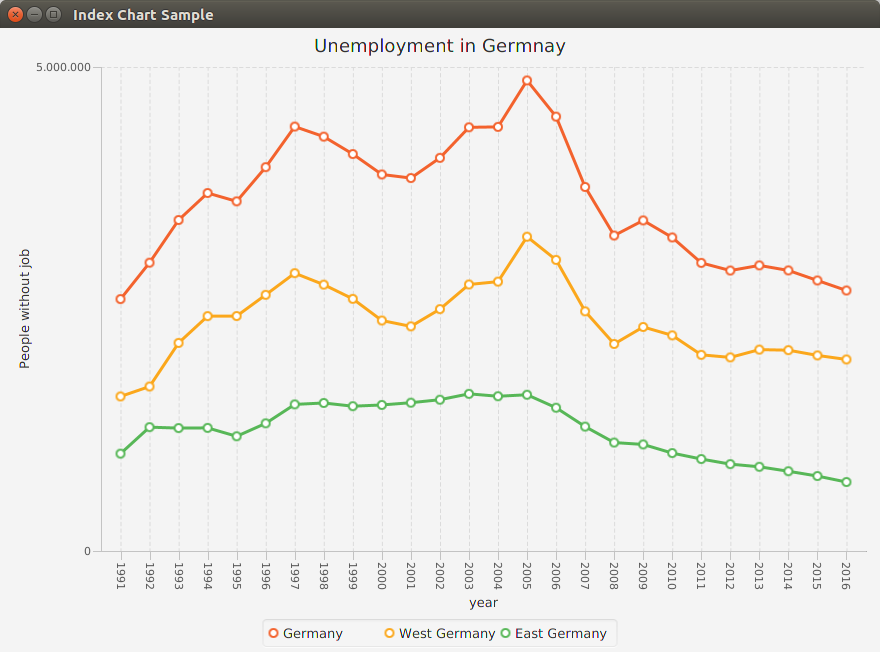
Let´s consider for example unemployment in Germany since the reunification. We will use a csv file containing year, amount of people in germany, west and east (four columns)
1991,2602203,1596457,1005745

1992,2978570,1699273,1279297

1993,3419141,2149465,1269676

1994,3698057,2426276,1271781

1995,3611921,2427083,1184838

1996,3965064,2646442,1318622

1997,4384456,2870021,1514435

1998,4280630,2751535,1529095

1999,4100499,2604720,1495779

2000,3889695,2380987,1508707

2001,3852564,2320500,1532064

2002,4061345,2498392,1562953

2003,4376795,2753181,1623614

2004,4381281,2782759,1598522

2005,4860909,3246755,1614154

2006,4487305,3007158,1480146

2007,3760586,2475528,1285058

2008,3258954,2138778,1120175

2009,3414992,2314215,1100777

2010,3238965,2227473,1011492

2011,2976488,2026545,949943

2012,2897126,1999918,897209

2013,2950338,2080342,869995

2014,2898388,2074553,823835

2015,2794664,2020503,774162

2016,2690975,1978672,712303
We can represent it with an index chart by using just JavaFX and the opencsv library:
package de.datascience.charts;

import java.io.FileReader;

import com.opencsv.CSVReader;

import javafx.application.Application;
import javafx.scene.Scene;
import javafx.scene.chart.CategoryAxis;
import javafx.scene.chart.LineChart;
import javafx.scene.chart.NumberAxis;
import javafx.scene.chart.ScatterChart;
import javafx.scene.chart.XYChart;
import javafx.stage.Stage;

public class UnemploymentGermany extends Application {

	@Override
	public void start(Stage stage) throws Exception {
		stage.setTitle("Index Chart Sample");
		final NumberAxis yAxis = new NumberAxis(0, 5000000, 1);
		final CategoryAxis xAxis = new CategoryAxis();

		final LineChart<String, Number> lineChart = new LineChart<>(xAxis, yAxis);
		yAxis.setLabel("People without job");
		xAxis.setLabel("year");
		lineChart.setTitle("Unemployment in Germnay");

		XYChart.Series series = new XYChart.Series();
		XYChart.Series seriesWest = new XYChart.Series();
		XYChart.Series seriesEast = new XYChart.Series();

		series.setName("Germany");
		seriesWest.setName("West Germany");
		seriesEast.setName("East Germany");

		try (CSVReader dataReader = new CSVReader(new FileReader("docs/unemployment_germany.csv"))) {
			String[] nextLine;
			while ((nextLine = dataReader.readNext()) != null) {
				String year = String.valueOf(nextLine[0]);
				int population = Integer.parseInt(nextLine[1]);
				series.getData().add(new XYChart.Data(year, population));
				int populationWest = Integer.parseInt(nextLine[2]);
				;
				seriesWest.getData().add(new XYChart.Data(year, populationWest));
				int populationEast = Integer.parseInt(nextLine[3]);
				seriesEast.getData().add(new XYChart.Data(year, populationEast));
			}
		}

		lineChart.getData().addAll(series, seriesWest, seriesEast);
		Scene scene = new Scene(lineChart, 500, 400);
		stage.setScene(scene);
		stage.show();
	}

	public static void main(String[] args) {
		launch(args);
	}
}
The output will be the following: